给客户写的一个多点频响colormap脚本
这是两年前写的一个小脚本。今天突然看到就整理下发上来。
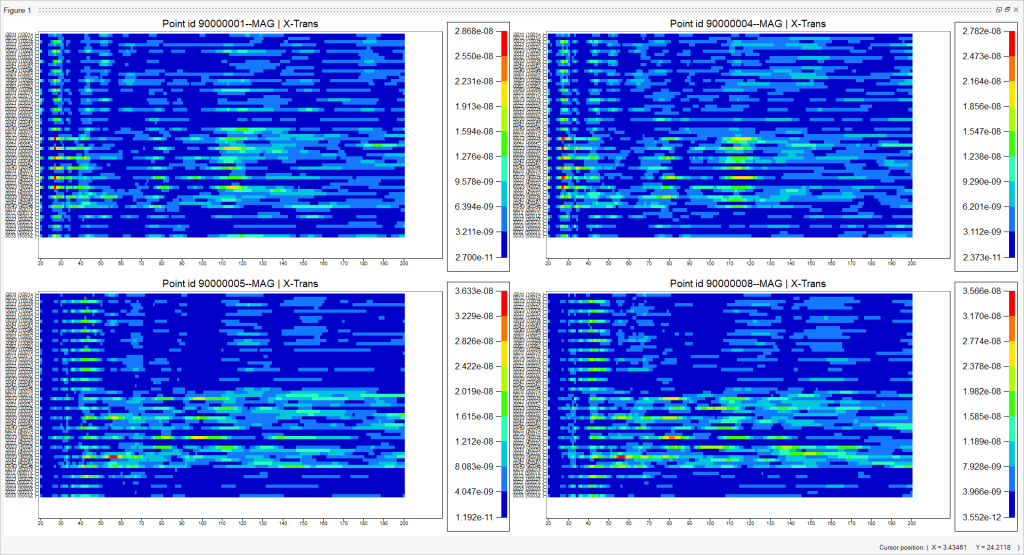
目标是类似发动机的nvh-colormap,全局地展示频响状态。
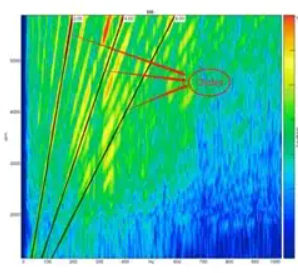
不一样的是,发动机阶次图的纵轴是转速,而客户需要的是不同的车身mount点位置。客户需求的示意图(客户所在公司也暂时倒闭了,这也不能算泄密了吧哈哈,部分安全打码):
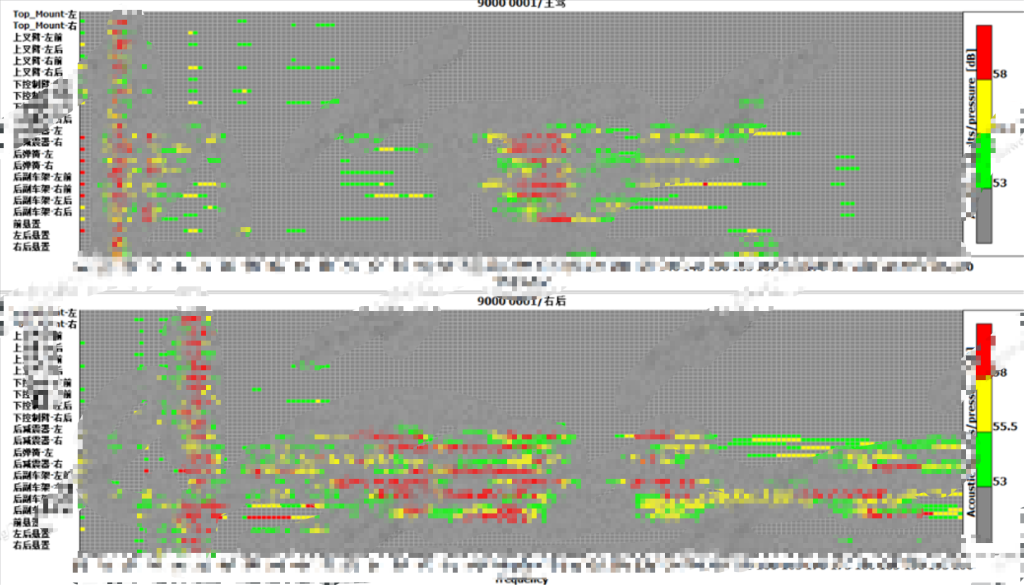
简单地说,每一行,就是一条frf频响曲线,只是通过颜色的方式来显示数值大小。客户上面这个表是excel做的,希望通过程序自动化。
输入是一份punch文件,格式类似下方:
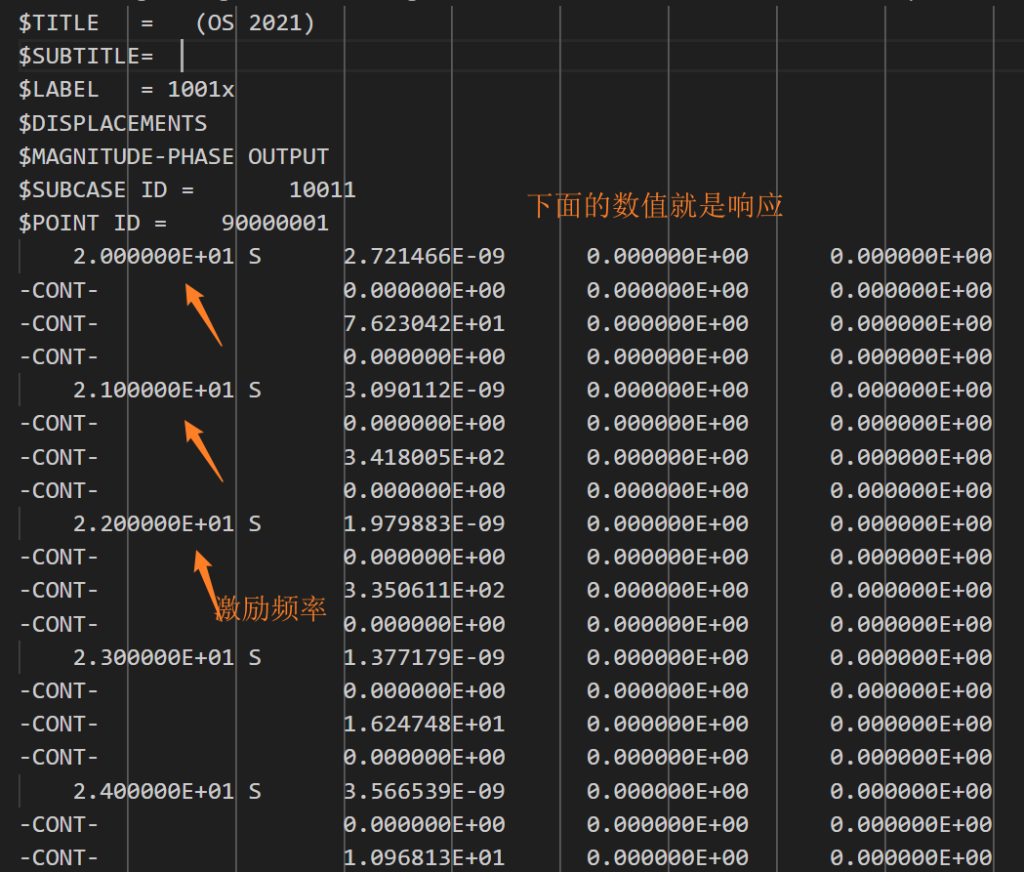
Altair的Compose软件提供了直接读取CAE结果的接口(毕竟是自家软件用着就是方便)。也就是通过命令可以将pch文件中的数值读出来成向量格式,然后就通过绘图工具直接画图。
以下是用到的Compose代码,感兴趣的可以试试。
filename='C:/Users/jwhu/Desktop/tmp/colormap/NTF_final_01.pch';
%subcase=['Subcase 10011 (1001x )';'Subcase 10012 (1001y )';'Subcase 10013 (1001z )';'Subcase 10021 (1002x )';'Subcase 10022 (1002y )';'Subcase 10023 (1002z )';'Subcase 10031 (1003x )';'Subcase 10032 (1003y )';'Subcase 10033 (1003z )';'Subcase 10041 (1004x )';'Subcase 10042 (1004y )';'Subcase 10043 (1004z )';'Subcase 10051 (1005x )';'Subcase 10052 (1005y )';'Subcase 10053 (1005z )';'Subcase 10051 (1005x )';'Subcase 10052 (1005y )';'Subcase 10053 (1005z )';'Subcase 10061 (1006x )';'Subcase 10062 (1006y )';'Subcase 10063 (1006z )';'Subcase 20011 (2001x )';'Subcase 20012 (2001y )';'Subcase 20013 (2001z )';'Subcase 20021 (2002x )';'Subcase 20022 (2002y )';'Subcase 20023 (2002z )';'Subcase 20031 (2003x )';'Subcase 20032 (2003y )';'Subcase 20033 (2003z )';'Subcase 20041 (2004x )';'Subcase 20042 (2004y )';'Subcase 20043 (2004z )';'Subcase 30011 (3001x )';'Subcase 30012 (3001y )';'Subcase 30013 (3001z )';'Subcase 30021 (3002x )';'Subcase 30022 (3002y )';'Subcase 30023 (3002z )';'Subcase 30031 (3003x )';'Subcase 30032 (3003y )';'Subcase 30033 (3003z )';'Subcase 30041 (3004x )';'Subcase 30042 (3004y )';'Subcase 30043 (3004z )';'Subcase 40011 (4001x )';'Subcase 40012 (4001y )';'Subcase 40013 (4001z )';'Subcase 40021 (4002x )';'Subcase 40022 (4002y )';'Subcase 40023 (4002z )';'Subcase 40031 (4003x )';'Subcase 40032 (4003y )';'Subcase 40033 (4003z )';'Subcase 40041 (4004x )';'Subcase 40042 (4004y )';'Subcase 40043 (4004z )';'Subcase 50011 (5001x )';'Subcase 50012 (5001y )';'Subcase 50013 (5001z )';'Subcase 50021 (5002x )';'Subcase 50022 (5002y )';'Subcase 50023 (5002z )';'Subcase 50031 (5003x )';'Subcase 50032 (5003y )';'Subcase 50033 (5003z )'];
%point=['Point id 90000001';'Point id 90000004';'Point id 90000005';'Point id 90000008'];
% Get subcase list: Subcase 10011 (1001x ) etc
subcase = getsubcaselist(filename);
DataType = 'Non Struct Disp';
%Get point id lists, i.e. 90000001, 90000004 etc.
request = getreqlist(filename,subcase{1},DataType);
%Get comp lists, i.e. MAG | X-Trans, MAG | Y-Trans, etc.
component=getcomplist(filename,subcase{1},DataType);
%% Choose component:
% 2 - MAG | X-Trans; 3 - MAG | Y-Trans; 4 - MAG | Z-Trans;
% 5 - MAG | X-Rot; 6 - MAG | Y-Rot; 7 - MAG | Z-Rot;
% 8 - PHA | X-Trans; 9 - PHA | Y-Trans; 10 - PHA | Z-Trans;
% 11 - PHA | X-Rot; 12 - PHA | Y-Rot; 13 - PHA | Z-Rot;
compfocus=component{2}
close

%% First Choose the Resp. Point id. %%
for j=1:size(request,2)
reqfocus = request{j};
% Read data from punch file.
matrix=[];
subplot(2,2,j)
%% Then create heatmap of different subcases (load paths) %%
for i = 1:size(subcase,2)
p1si=readcae(filename,subcase{i},DataType,reqfocus,compfocus,{},1);
p1si=reshape(p1si,1,[]);
matrix=cat(1,matrix,p1si);
end
% Create Heatmap
imagesc(matrix);
colorbar;
titletext=strcat(reqfocus,'--',compfocus);
title(titletext);
%% Set Axis Ticks and Labels %%
% Get all time steps, i.e. Frequency list.
frqs=gettimesteplist(filename,DataType,request{1},compfocus);
%xtick steps
xstep=10;
xtickvalues=1:xstep:size(matrix,2);
xticklabels=frqs(1:xstep:end);
xticklabels=num2cell(xticklabels);
xticklabels=cellfun(@num2str,xticklabels, 'UniformOutput', false);
set(gca,'XTick',xtickvalues,'XTickLabel',xticklabels)
ytickvalues=1:size(matrix,1);
yticklabels=subcase();
set(gca,'YTick',ytickvalues,'YTickLabel',yticklabels,'ynumericformat','fixed','xnumericprecision',5)
end
原始punch文件,可以加我微信私发你,这个还是有点敏感无法直接给。
最后的效果: